¶ Evapotranspiration (ET)
¶ What is ET
Evapotranspiration is the sum of two water loss processes: evaporation, and transpiration. Evaporation is the rate at which water evaporates into the air from the ground, while transpiration is the movement of water up from the ground through a plant and out its leaves. These processes can be used to represent negative rainfall and can be indicators of dry or wet weather.
- Evaporation
Evaporation is an important factor to take into account when planning water management. Not all rainfall stays in the soil or makes it into the roots of a plant. Hot or windy weather can dry out the top layers of soil, stopping rainfall from being effective. Depending on location and season, small showers can be completely evaporated before making it to a plant's roots. However, cool sheltered locations can keep the soil damp for a long time without regular rainfall.
- Transpiration
Plants require water for a wide variety of important functions, such as creating energy, structural support, and new growth. These processes require the inside of a plant to be kept much damper than the surrounding air. However, this moisture can escape through a plant’s breathing process as water vapour. This constant loss of water will dry out a plant without a regular uptake of water from the soil. This cycle is called transpiration, and it forms a constant flow of water out of the soil and into the air. This process can dry the soil out from deep underground, regardless if evaporation from the surface has stopped.
¶ Why is ET important
Measuring and forecasting rainfall is only half of the picture when trying to predict water availability. ET makes up a large majority of the water lost from horticultural systems. When compared with rainfall, ET allows us to calculate how much moisture is both entering and leaving the soil. This can give indications as to whether or not growers are at risk of having dry periods and may need to irrigate. Calculating how much water is lost by different plants in different climates is crucial to understanding how impactful rainfall and dry spells are to different agriculturalists.
¶ How does the ET Tool work?
¶ Factors
Several principal factors impact the volume of water lost through ET.
These are:
- Solar radiation
- Wind Speed
- Humidity
- Air Temperature
- Crop type
- Soil/Canopy Coverage
Our national weather station network collects climate data from around New Zealand to calculate the effective ET all over the nation. Forecasted ET is calculated with IBM’s modeled climate data and long-term daily seasonal averages, these are regularly updated to be as accurate as possible given the possibility of forecast data changing.
¶ Crop Factor Selection
The canopy covers and life stages of different plants have been integrated and listed at the head of the tool in simplified categories. These can be selected to create a more accurate calculation of ET, tailored to individual growers' plant coverage.
Adding more Crop Factors to the model requires you to input the coverage of each plant type. With a single factor, this is automatically at 100% coverage. However, upon adding another, both can be edited to represent a different proportion of a target plot.
When adding a crop factor there are three fields to change.
Moving from left to right:
(1) the crop co-efficient: This will be a number between 0 and 2 that represents how effective the plant is at losing water. These are preset but can be changed manually if needed.
(2) Crop Type: This will allow the selection of a present crop coefficient for your crop.
(3) Coverage: This will allow you to have multiple plants taken into account when trying to calculate the ET of an area. This number is a percentage of ground covered and must always accumulate to 100.

¶ Understanding Results
¶ Week Ahead Forecast Overview
The week ahead forecast widget will display the most recent data from the current forecasted week ahead, regardless of the start/stop date input. It does however take into account station and crop factor inputs to calculate a local personalized ET forecast.
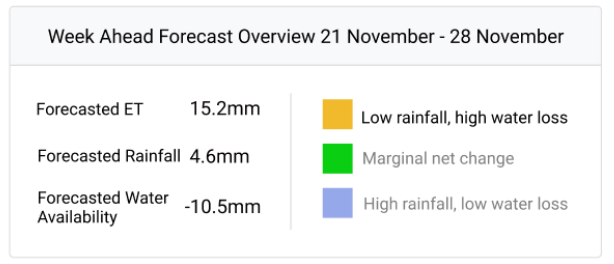
- Forecasted ET: This is the cumulative ET for the target crops and station in the upcoming week
- Forecasted Rainfall: This is the cumulative rainfall for the chosen station in the upcoming week
- Forecasted water availability: This is the forecasted net difference in ET and rainfall. It represents how many millimetres of water are going to be added or removed from the soil in the coming 7 days.
¶ Weekly Alert:
The weekly forecasted alert is based on the net water gain/loss that is modelled for your crops and location. Significant water loss or accumulation is indicated through a traffic light system for ease of interpretation.
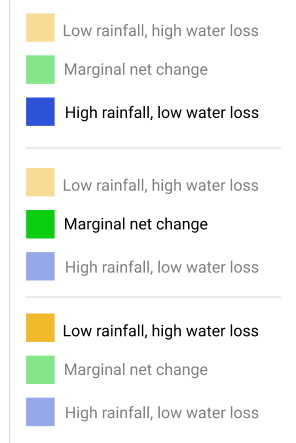
High rainfall, low water loss is identified as a net gain of >10mm of water to the soil
Marginal net change is identified as the soil water content staying within 10mm of water gain/loss for the week
Low rainfall, high water loss is identified as a net loss of >10mm of water to the soil
¶ Daily soil moisture change
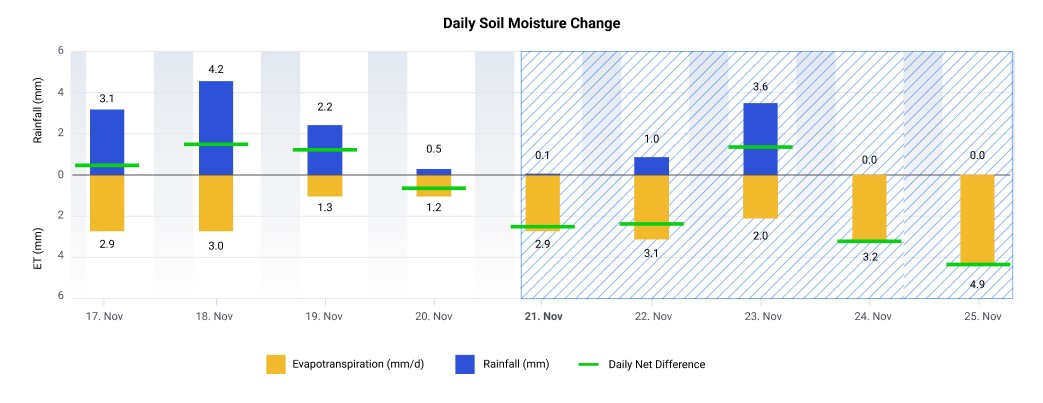
The daily soil moisture graph shows a bar chart with a positive and negative Y axis.
- Yellow bars represent daily ET loss.
- Blue bars represent daily rainfall.
- Green candlesticks represent the daily net gain/loss of water.
The X-axis represents daily intervals. The start and stop date can be entered at the top of the tool to create the displayed data range.
ET forecast projections will be available seven days into the future, and these are signified by a blue-lined overlay.
¶ Period summary
A data table showing the results for the chosen period, location, and crop factors is available below the graph. A data summary can also be exported for personal use.
Data available in the table summary includes:
- Date
- Forecast Days
- Rainfall
- Cumulative rainfall
- ET
- Cumulative ET
- Daily Net difference (Rainfall - ET)
- Period accumulation (Rainfall - ET)
* Please note: Period accumulation is not an accurate representation of soil moisture when looking at large time scales. This is due to soil having a maximum and minimum holding capacity for water. When exceeded, excess water drains away. For a more accurate soil moisture value, look into creating a water budget with the fill point of your soil taken into account.